

As my second week in my security intensive study a huge opportunity appeared in my life! Casually, I’ve been asked to guide a group of students into Network monitoring and Forensic, which is already my favourite security module. I wanted to study in a wider range, as I already said in week one, but right now I should put most of my efforts in the group goals, also I’m excited with the opportunity of learning from these guys.
Anyway, I’d like to start this article with a brief explanation on “where to sniff”, where in a network should we collect the data from. This is a difficult decision, also not all networks are the same… Let’s take a look into an example.
The Gary’s comic-book store network (sorry for the crappy sketch):
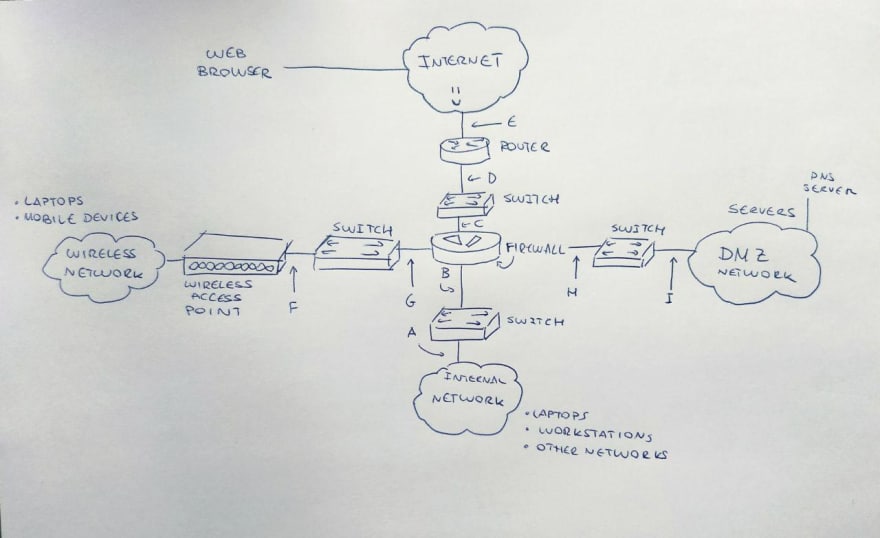
Okay so this is the scheme of Gary’s comic book store network (I completely made up the name, sorry if I guessed a real shop name), there are different paths we should be taking care of, depending on our interests. For example, if we are interested in the path from the workstation to the server, we should be taking care of monitoring in both directions in points from A to E and also another new one between the INTERNET and the WEB SERVER itself.
From the Gary’s laptop to a web server we will be taking care of monitoring F-G-C-D-E+Internet/web server in both directions, or from the local DNS server to a web one on the internet I-H-C-D-E+internet/DNS in both directions, too.
It’s the security expert’s duty to identify where the network could be compromised and then act against it. Each segment we pointed has a group of addresses assigned in what we call “net blocks”. The firewall will translate (NAT-Network addresses translation) the addresses to a different value, for example 192.168.2.100 to 192.168.1.100. On a similar way, we can find NPAT (Network Port Address Translation) for wireless and internal networks.
Anyway based on this, it’s a nice option to discard monitoring points C, D and E to start with as they are kept within the company. Anyway in our case I would say monitoring G, B and H are the best options, as they contain true destination IP addresses.
I’m going to leave the physical access troubles and options for another time, as now my point is exposed, I would like to introduce tcpdump. There are several tools for Network System Monitoring depending on which phase of the analysis we want to focus on. Today I want to focus on Data Presentation. This will help analysts to get data exposed.
Tcpdump displays results in real time (or writes a log) when working against a live network, or a saved trace file for forensic, which comes in handy for CTF’s games for example. Installing tcpdump (in debian jessie, but I guess it’s the same in other common systems like ubuntu) is as easy as:
sudo apt-get install tcpdump
Once we have it, we actually have most of the info in the man page. For example:
tcpdump -n -i eth1 -c 5
In the command we are telling the tcpdump not to resolve IP addresses to hostnames via DNS queries, which interface to monitor hand to count how many packages should it capture. Ah, by the way, you will need to use sudo for tcpdump. We should receive five packages, first one is a UDP (User Datagram Protocol) packet, the rest are TCP (Transmission Control Protocol) packets. With this information we can study the nature of the connection and deduce stuff, from the protocols, ips, data lengths… In case we want to save this data in a log for a later study, we can use -w.
sudo tcpdump -n -i eth1 -c 5 -w example.pcap
And open it using -r to read it later.
tcpdump -n -r example.pcap
Apart from this you guys can use filters, or forcing a different information style (like the timestamp style) and such. Anyway I hope you guys enjoyed this basic tutorial about NSM. Be good, tho!

Originally written in: https://dev.to/terceranexus6/security-sprint-week-2—choosing-a-nice-point-to-sniff-and-using-tcpdump-for-packet-analysis–e9